A field note on reading CPUCentral Processing Unit: the chip that executes program instructions, measured by its cores, threads, clock speed, and cache. Read more → usage correctly. Facts and tests as of Nov 4, 2026.
The short version
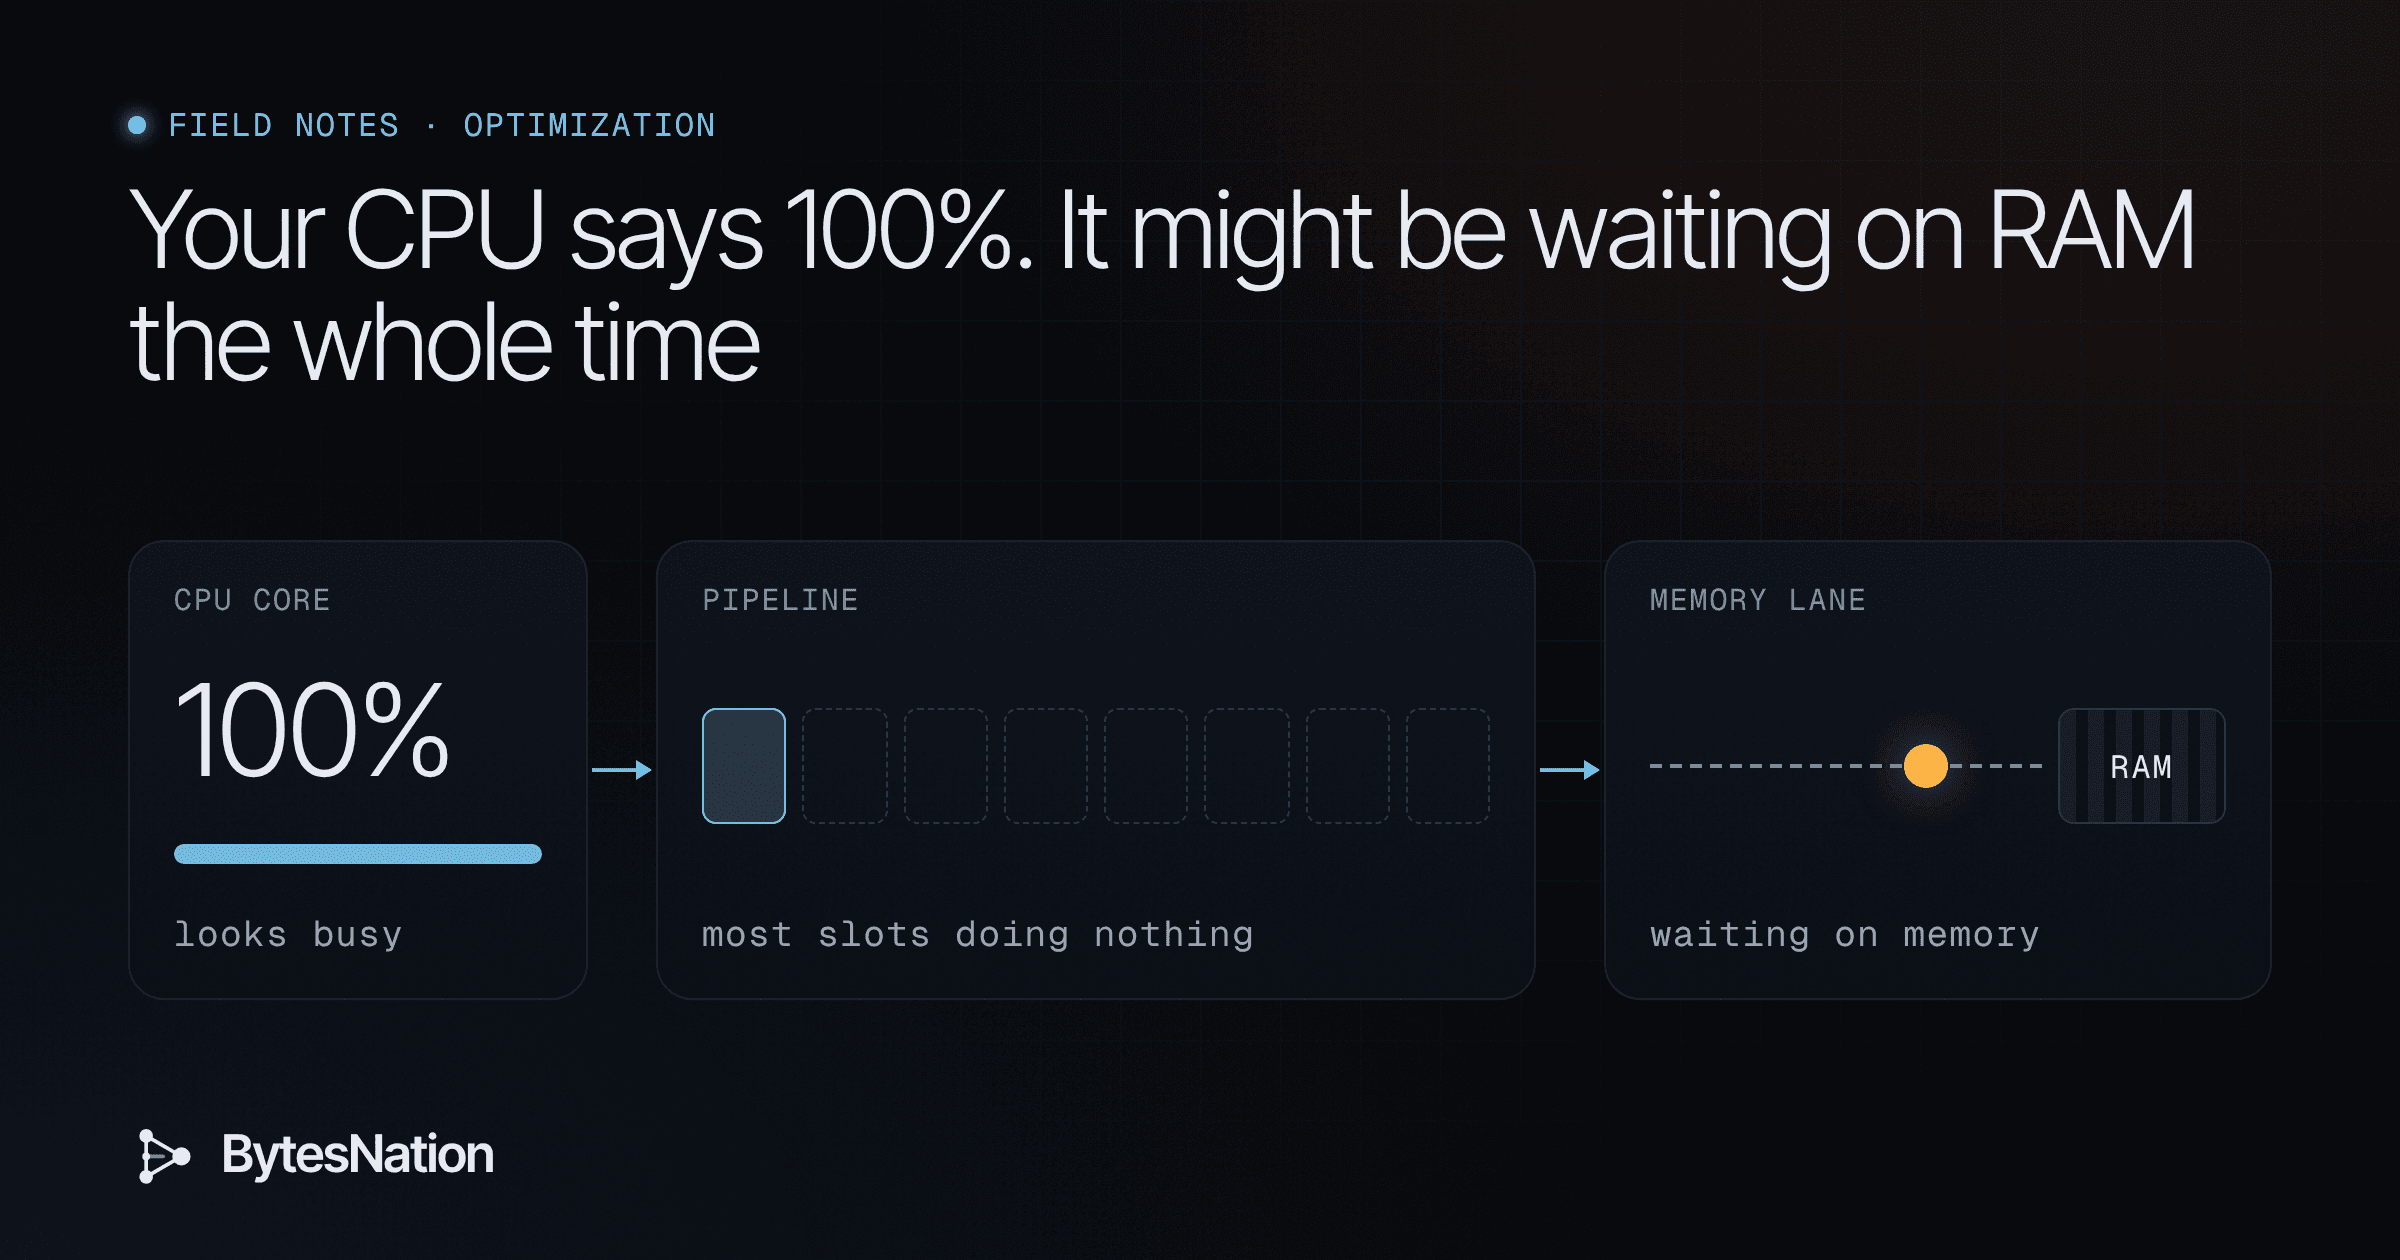
When top or Task Manager shows a core at 100%, most people read it as “the processor is maxed out, buy a faster one.” Sometimes that’s right. Often it isn’t. That 100% only means the core had something scheduled on it the whole time. It doesn’t say whether the core was doing work or sitting there waiting for data to arrive from RAMRandom Access Memory: the fast, temporary working memory that holds the programs and data a computer is using right now, cleared when power is lost. Read more →.
On Oct 28, 2026, the team behind the Pivot database published a write-up where a simple GROUP BY query had a core “busy” for 3.6 seconds. The hardware counters showed that 50.1% of the core’s pipeline slots were stalled waiting on memory, and only 16.1% were doing useful work. They made the query faster by having the CPU do more instructions, arranged so it waited on RAM less.
I wrote a small benchmark and ran it on our box. Same number of memory reads, same program, both runs kept one core at 100% the whole time. One order of reads cost about 1.4 ns each. The other cost 222 ns each. Below is the reasoning, the commands to prove it on your own machine, and the output.
Why a busy CPU can be doing almost nothing
A modern CPU core is fast. RAM is slow by comparison. The Pivot postPower-On Self-Test: the quick hardware check firmware runs every time a computer starts, before it looks for an operating system. Read more → gives these rough figures (theirs, not measured by us):
| Where the data is | Rough time per access | Work a core could do in that time |
|---|---|---|
| L1 cache | about 1 ns | about 4 to 8 instructions |
| L2 cache | about 3 to 4 ns | about 15 to 30 instructions |
| L3 cache | about 10 to 15 ns | about 50 to 100 instructions |
| RAM (DRAM) | about 50 to 100 ns | about 400 to 800 instructions |
A kitchen is a fair picture. The cook is the core. The cutting board is L1, the fridge is L2 and L3, and RAM is a warehouse across town. If every dish needs a warehouse run, the cook is on shift all day and looks fully booked, but most of that shift is spent standing at the back door waiting for the van.
Some terms we’ll use:
- Cache: small, very fast memory on the CPU chip (L1, L2, L3) that holds recently used data.
- Cache miss: the data isn’t in that cache level, so the core goes to the next, slower one.
- Stall: cycles where the core can’t make progress because an instruction is waiting, most often on memory.
- IPC (instructions per cycle): how many instructions the core finished per clock tick. Higher is better. Low IPC at 100% CPU is the stall signature.
- Prefetch: the CPU guessing which data you’ll need next and fetching it early. It works well on data read in order and poorly on random lookups.
- Hardware counters (PMCs): registers built into the CPU that count events like cycles, instructions and cache misses. Linux reads them with
perf.
Brendan Gregg made this point back in 2017 in “CPU Utilization is Wrong”. What we call CPU utilization is really “non-idle time”: the kernelThe core of an operating system that runs with full hardware control and decides how every program gets CPU time, memory, and device access. Read more → counts a core as busy whenever something other than the idle thread is running on it. Whether that thread is finishing instructions or waiting on memory doesn’t change the number.
Why it matters before you spend money
The fix depends on which kind of busy you have, and the two fixes point in opposite directions.
If the core is truly doing work (instruction bound), a faster clock, more cores or less code helps. If it’s waiting on memory (memory bound), a faster clock barely moves the needle, because the core just waits faster. What helps there is touching less memory, touching it in a friendlier order, keeping it closer to the core, or a CPU with bigger caches.
Gregg’s rule of thumb: IPC under 1.0 likely means memory stalled, over 1.0 likely means instruction bound. He’s upfront that he picked 1.0 from experience, and he suggests calibrating your own line: write one workload you know is CPU bound and one you know is memory bound, measure both, and take the midpoint. That’s good practice in general. A threshold you measured on your own hardware beats one you read in a blog post, including this one.
What I ran, and what came out
I wanted readers to see the effect without special hardware or root access, so I wrote a pointer-chase benchmark. It builds a chain of 64-byte nodes (one cache line each), where each node holds the address of the next. Following the chain means every read depends on the one before it, so the CPU can’t skip ahead or overlap them. That makes the time per hop a fair measure of how far away the data was.
It runs two ways over the same nodes:
- Random order: the chain jumps around the buffer in one big shuffled loop. The prefetcher can’t guess the next address.
- Sequential order: the chain walks the buffer front to back. The prefetcher can stay ahead.
Each run grows the buffer from 16 KiB to 1 GiB and does 50 million hops at each size. Here’s the whole thing, about 30 lines of C. Save it as chase.c:
// chase.c: pointer-chase latency vs working-set size, BytesNation lab, Nov 4 2026
// Build: gcc -O2 -o chase chase.c   Run: ./chase
#include <stdio.h>
#include <stdlib.h>
#include <stdint.h>
#include <time.h>
#define LINE 64
typedef struct node { struct node *next; char pad[LINE - sizeof(void*)]; } node;
static double now(void){struct timespec t;clock_gettime(CLOCK_MONOTONIC,&t);return t.tv_sec+t.tv_nsec*1e-9;}
static uint64_t rng=88172645463325252ULL;
static uint64_t xr(void){rng^=rng<<13;rng^=rng>>7;rng^=rng<<17;return rng;}
int main(int argc,char**argv){
  size_t sizes_kb[]={16,32,256,1024,4096,16384,65536,262144,1048576};
  int mode = argc>1 ? atoi(argv[1]) : 0; // 0 = random order, 1 = sequential order
  printf("%-12s %10s\n","working_set","ns_per_load");
  for(size_t s=0;s<sizeof sizes_kb/sizeof *sizes_kb;s++){
    size_t n=sizes_kb[s]*1024/LINE;
    node*a=aligned_alloc(4096,n*sizeof(node));
    size_t*idx=malloc(n*sizeof(size_t));
    for(size_t i=0;i<n;i++)idx[i]=i;
    if(mode==0) for(size_t i=n-1;i>0;i--){size_t j=xr()%i;size_t t=idx[i];idx[i]=idx[j];idx[j]=t;} // Sattolo: one big cycle
    for(size_t i=0;i<n;i++)a[idx[i]].next=&a[idx[(i+1)%n]];
    free(idx);
    size_t steps=50000000; node*p=&a[0];
    for(size_t i=0;i<n;i++)p=p->next; // warm up
    double t0=now(); for(size_t i=0;i<steps;i++)p=p->next; double t1=now();
    char lbl[32]; if(sizes_kb[s]>=1024)snprintf(lbl,32,"%zu MiB",sizes_kb[s]/1024); else snprintf(lbl,32,"%zu KiB",sizes_kb[s]);
    printf("%-12s %10.2f%s\n",lbl,(t1-t0)*1e9/steps,p?"":"!");
    free(a);
  }
  return 0;
}
Build and run:
gcc -O2 -o chase chase.c
time ./chase 0    # random order
time ./chase 1    # sequential order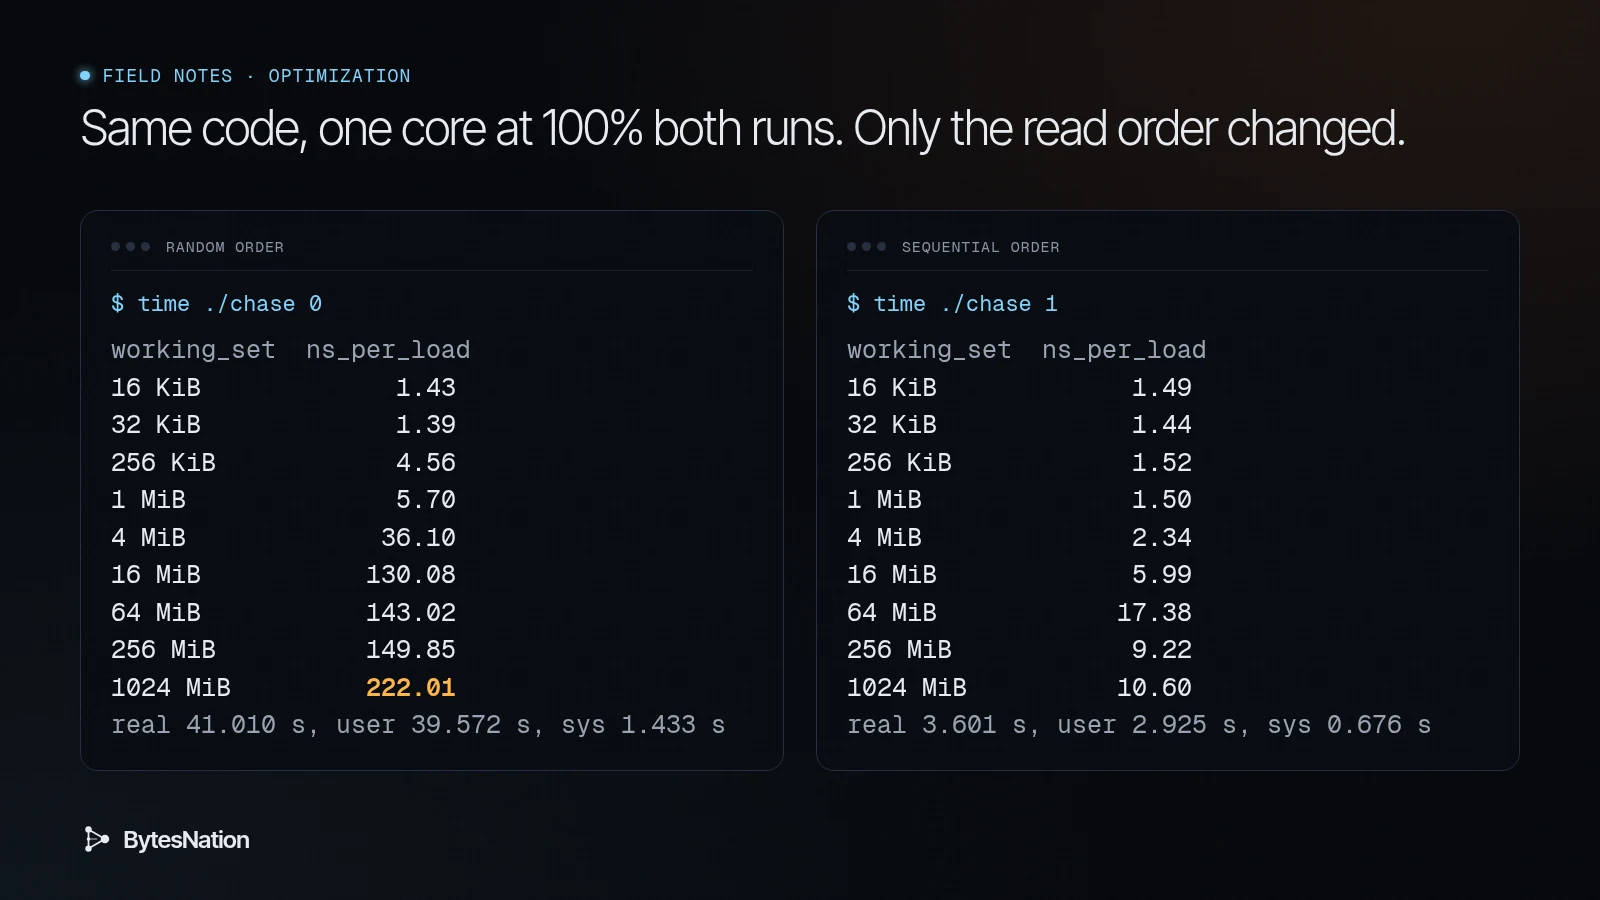
The box: a KVMA Linux kernel module that turns the Linux operating system itself into a Type 1 hypervisor, enabling hardware-accelerated virtual machines. Read more → virtual machineA software-based emulation of a complete computer that runs its own operating system and applications, isolated from the host hardware. Read more → reporting an “Intel(R) Xeon(R) Processor”, 8 vCPUs, kernel 6.12, gcc 14.2.0. lscpu reports L1d 384 KiB across 8 instances (48 KiB each), L2 16 MiB across 8 (2 MiB each) and L3 320 MiB shared. One run each, on a shared VM, Nov 4, 2026.
Random order, copied from the terminalThe window or screen where you type text commands and read their output, connected to a shell that runs those commands. Read more →:
working_set  ns_per_load
16 KiB             1.43
32 KiB             1.39
256 KiB            4.56
1 MiB              5.70
4 MiB             36.10
16 MiB           130.08
64 MiB           143.02
256 MiB          149.85
1024 MiB         222.01
real 41.010 s, user 39.572 s, sys 1.433 s
Sequential order, same nodes, same number of hops:
working_set  ns_per_load
16 KiB             1.49
32 KiB             1.44
256 KiB            1.52
1 MiB              1.50
4 MiB              2.34
16 MiB             5.99
64 MiB            17.38
256 MiB            9.22
1024 MiB          10.60
real 3.601 s, user 2.925 s, sys 0.676 s
How I read it, step by step:
- Both runs were “100% CPU.” In each, user plus sys time adds up to the real time. If you watched either in
top, you’d see one core pinned the entire run. Nothing in that view tells them apart. - Small buffers cost the same either way. At 16 KiB and 32 KiB everything fits in L1, so random or sequential, a hop costs about 1.4 ns.
- The steps in the random column line up with the cache sizes. Past 48 KiB of L1 it climbs to 4 to 6 ns. Past the 2 MiB of L2 per core it jumps to 36 ns, then to 130 ns and up.
- At 1 GiB, random order costs about 21 times more per read (222 ns against 10.6 ns). Same data, same number of reads. The only change is whether the next address was predictable.
- The random run spent about 41 seconds “busy” against 3.6 for the sequential run. Part of that gap is setup (shuffling the chain also hits memory at random), so I’m comparing per-hop numbers above, not total time.
What I’m not claiming from this:
- These aren’t clean DRAM latency figures. The jump to 130 ns and up starts at 16 MiB, well under the 320 MiB L3 that
lscpureports. On a shared VM, I don’t know how much of that L3 this guest actually gets, and with 4 KiB pages a random walk also misses the TLB (the CPU’s cache of address translations), which adds its own memory trips. Both likely contribute. I didn’t isolate them. - The sequential 64 MiB number (17.38 ns) is higher than 256 MiB (9.22 ns). That’s almost certainly noise from a neighbor on the host. One run, shared hardware.
- No IPC numbers.
perfisn’t installed in this container,perf_event_paranoidis 2, and many VMs don’t expose hardware counters to guests anyway. Gregg notes the same about cloud VMs, and Pivot ran on bare metal for that exact reason. So I can show you the symptom here, not the counter proof. The counter proof is the next section, for your own hardware.
The troubleshooting path: from “slow” to “proven memory bound”
This is the order I’d work it on a real box. Each step either rules something out or narrows it down, so you don’t tune the wrong thing.
1. Is it actually on CPU? Run top or pidstat 1 (from the sysstat package). If the process is mostly waiting on disk, network or a lock, it isn’t a CPU problem at all, and nothing below applies. Stop and look there.
2. Pin it, so the numbers are clean. taskset -c 3 ./app keeps the process on one core, so counters on that core belong to it. Pivot did exactly this.
3. Read IPC. On bare metal or a VM that exposes counters:
perf stat -e cycles,instructions,cache-references,cache-misses -- ./appor attach to something already running with -p <PID> -- sleep 10. perf prints IPC as “insns per cycle”. Compare it against your own calibrated line from earlier, or Gregg’s 1.0 to start.
4. See where the pipeline slots go. The perf stat man page documents --topdown, which breaks cycles into front end, bad speculation, back end and retiring, plus -M for named metric groups. Metric names differ between Intel and AMD and between CPU generations. Pivot used -M backend_bound_memory,retiring on an AMD EPYC 9124. Run perf list metricgroups on your machine before you copy anyone’s command. On Intel, Andi Kleen’s pmu-tools wraps this method as toplev (./toplev -l1 -- ./app, then -l2 to drill into memory bound).
5. Find which loads miss. perf mem samples loads and stores and reports where they were served from. It needs sampling support in the CPU; on AMD the man page says it uses IBS.
6. Slow only with many threads? Check for false sharing (two cores fighting over one cache line) with perf c2c: perf c2c record -a -- sleep 10, then perf c2c report.
7. On multi-socket or chiplet servers, check NUMA. Some RAM is near a core and some is far. numactl --hardware shows the layout and numastat -p <PID> shows where a process’s memory lives. Try numactl --cpunodebind=0 --membind=0 ./app against the default and compare.
8. Check the TLB. perf stat -e dTLB-loads,dTLB-load-misses -- ./app. If misses are high, huge pages make each translation cover more memory. Check your setting with cat /sys/kernel/mm/transparent_hugepage/enabled (our box: always [madvise] never). The kernel docs explain the three modes.
9. Change the data, then re-measure the same counters. The proof isn’t “it feels faster.” It’s the before and after on wall time and the counters, the way Pivot showed it.
What the fix looked like in the Pivot case
The Pivot team ran SELECT count(*), UserID FROM hits GROUP BY UserID on ClickBench’s 99 million row “hits” dataset, about 17 million unique users, pinned to one core of an AMD EPYC 9124 on bare metal. All numbers below are from their post.
| Simple hash table | Partitioned (4096 parts) | |
|---|---|---|
| Warm run time | 3.6 s | 2.7 s |
| Slots stalled on memory | 50.1% | 23.5% |
| Slots retiring work | 16.1% | 32.2% |
| Operations retired | 11,431,618,219 | 19,350,459,182 |
| Pulled from DRAM on demand | about 4.5 GB | about 1.5 GB |
One big hash table with 17 million entries can’t fit in cache, so nearly every lookup goes to RAM. They split the rows into 4096 buckets by the top 12 bits of each key’s hash, then built a small hash table per bucket, one at a time. Each small table fits in cache. That’s about 69% more operations. It still won, because it traded trips to RAM for work the core could do right away.
That’s the lesson to carry into your own code: count cache misses and bytes from RAM, not just instructions. Their production engine got the same query to 1.848 s on one core and 171.773 ms across 16.
Tradeoffs worth knowing before you tune
- Counters in the cloud. Many VM types hide hardware counters. For real numbers, use bare metal, a dedicated host, or your homelab.
- Huge pages aren’t free. They cut TLB misses, but the kernel docs spell out one cost. With the separate
defragsetting on “always”, an app can stall on allocation while the kernel reclaims and compacts memory to build a huge page. If a database runs on the box, check what its vendor says about THP before you change the setting. - NUMA pinning lowers latency but can strand memory on one node and makes scheduling less flexible.
- Prefetching helps data read in order. Random hash lookups defeat it, which is why making the working set fit in cache matters so much. On our box, tinymembench’s “C copy prefetched” line also came out slower than its plain copy, a reminder that software prefetch can hurt. One run on a shared VM, so treat it as a hint, not a rule.
- Latency isn’t the only wall. When every core hits RAM at once, bandwidth can run out before latency matters.
- Benchmarks tell you about the machine, not your app. Tools like Intel’s Memory Latency Checker can turn prefetchers off to measure raw latency, which is not what your app sees with them on. Measure the app.
Your first step tonight
Build the benchmark and see your own cache steps. Save the C code from earlier in this article as chase.c, then:
gcc -O2 -o chase chase.c && ./chase 0 && ./chase 1No root needed. Watch where the random column jumps and compare it with lscpu | grep -i cache.
If you’d rather use an established tool, tinymembench builds in seconds and also reports memory bandwidth:
git clone https://github.com/ssvb/tinymembench && cd tinymembench && make && ./tinymembenchThen, on bare metal or a homelab box (a Proxmox host works), run perf stat -e cycles,instructions -- <your slow command> against the thing you’ve been meaning to speed up, and read the IPC before you price out a new CPU.
Sources
- Maor Kern, Pivot blog, Oct 28, 2026: https://pivotlake.io/blog/its-the-memory-latency-stupid/
- Brendan Gregg, “CPU Utilization is Wrong,” May 9, 2017: https://www.brendangregg.com/blog/2017-05-09/cpu-utilization-is-wrong.html
- perf-stat(1): https://man7.org/linux/man-pages/man1/perf-stat.1.html
- perf-mem(1): https://man7.org/linux/man-pages/man1/perf-mem.1.html
- perf-c2c(1): https://man7.org/linux/man-pages/man1/perf-c2c.1.html
- numastat(8): https://man7.org/linux/man-pages/man8/numastat.8.html
- Linux kernel, Transparent Hugepage Support: https://docs.kernel.org/admin-guide/mm/transhuge.html
- pmu-tools: https://github.com/andikleen/pmu-tools
- tinymembench: https://github.com/ssvb/tinymembench
- Intel Memory Latency Checker: https://www.intel.com/content/www/us/en/developer/articles/tool/intelr-memory-latency-checker.html
- Our lab: chase.c (above) and the raw output shown, run on our box Nov 4, 2026.